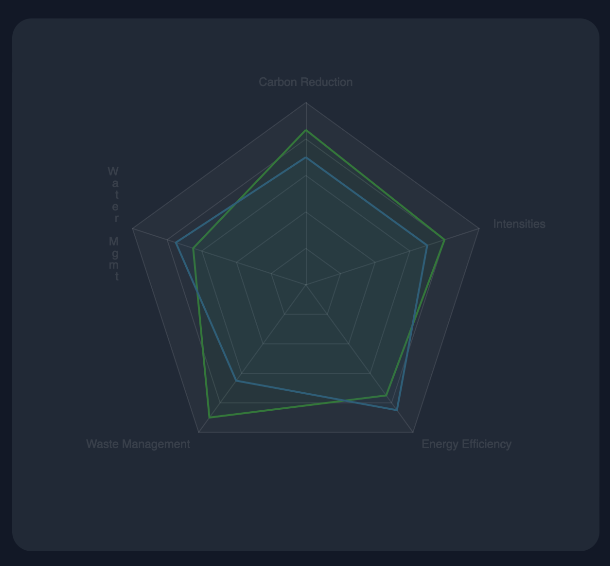
Cluster Comparisons
Compare sustainability metrics across industry cluster and cluster companies


Scope 1
Direct greenhouse gas emissions from sources owned or controlled by the company, including fuel combustion and company vehicles.
Scope 2
Indirect greenhouse gas emissions from purchased electricity, steam, heating and cooling consumed by the company.
Scope 3
Value chain emissions including upstream and downstream activities, representing indirect emissions not covered in Scope 2.
Energy Usage
Measures the total energy consumption across all operations, including electricity, fuel, and other energy sources used in company facilities and processes.
Water Usage
Tracks total water consumption and efficiency across operations, including water recycling and conservation initiatives to minimize environmental impact.
Waste Recycled
Measures the percentage of total waste that is recycled or reused through company's waste management programs and initiatives.
Company Comparison
| Company | Scope 1 | Scope 2 | Scope 3 | Water Usage | Energy Usage | Waste Recycled | ESG Score | ESG Rating |
|---|
Intensity Metrics
Carbon Intensity
| Metric | Your Company | Industry Average |
|---|
Energy Intensity
| Metric | Your Company | Industry Average |
|---|
Water Intensity
| Metric | Your Company | Industry Average |
|---|